-
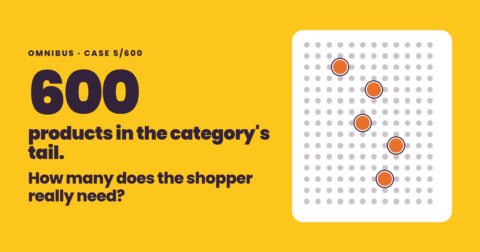
When 5 > 600. How many products does the shopper really need?
- by OmnibusTag: assortment optimization
INSIGHTS · CASE 5/600After my talk at the Prodaja na policah conference, I often heard one sentence in conversation: “We’re cutting our range too.” Or: “We know we have too many products in our portfolio.” At a time when discounters are advancing relentlessly, in Slovenia too, that is understandable.
Yet cutting the range only makes sense if it lets the remaining products flourish. And if it frees up space for new successful products.
Cutting the range is not the end goal, but a lever for reaching the real one: a really good offer that shoppers like to come back to.Why are sales falling?
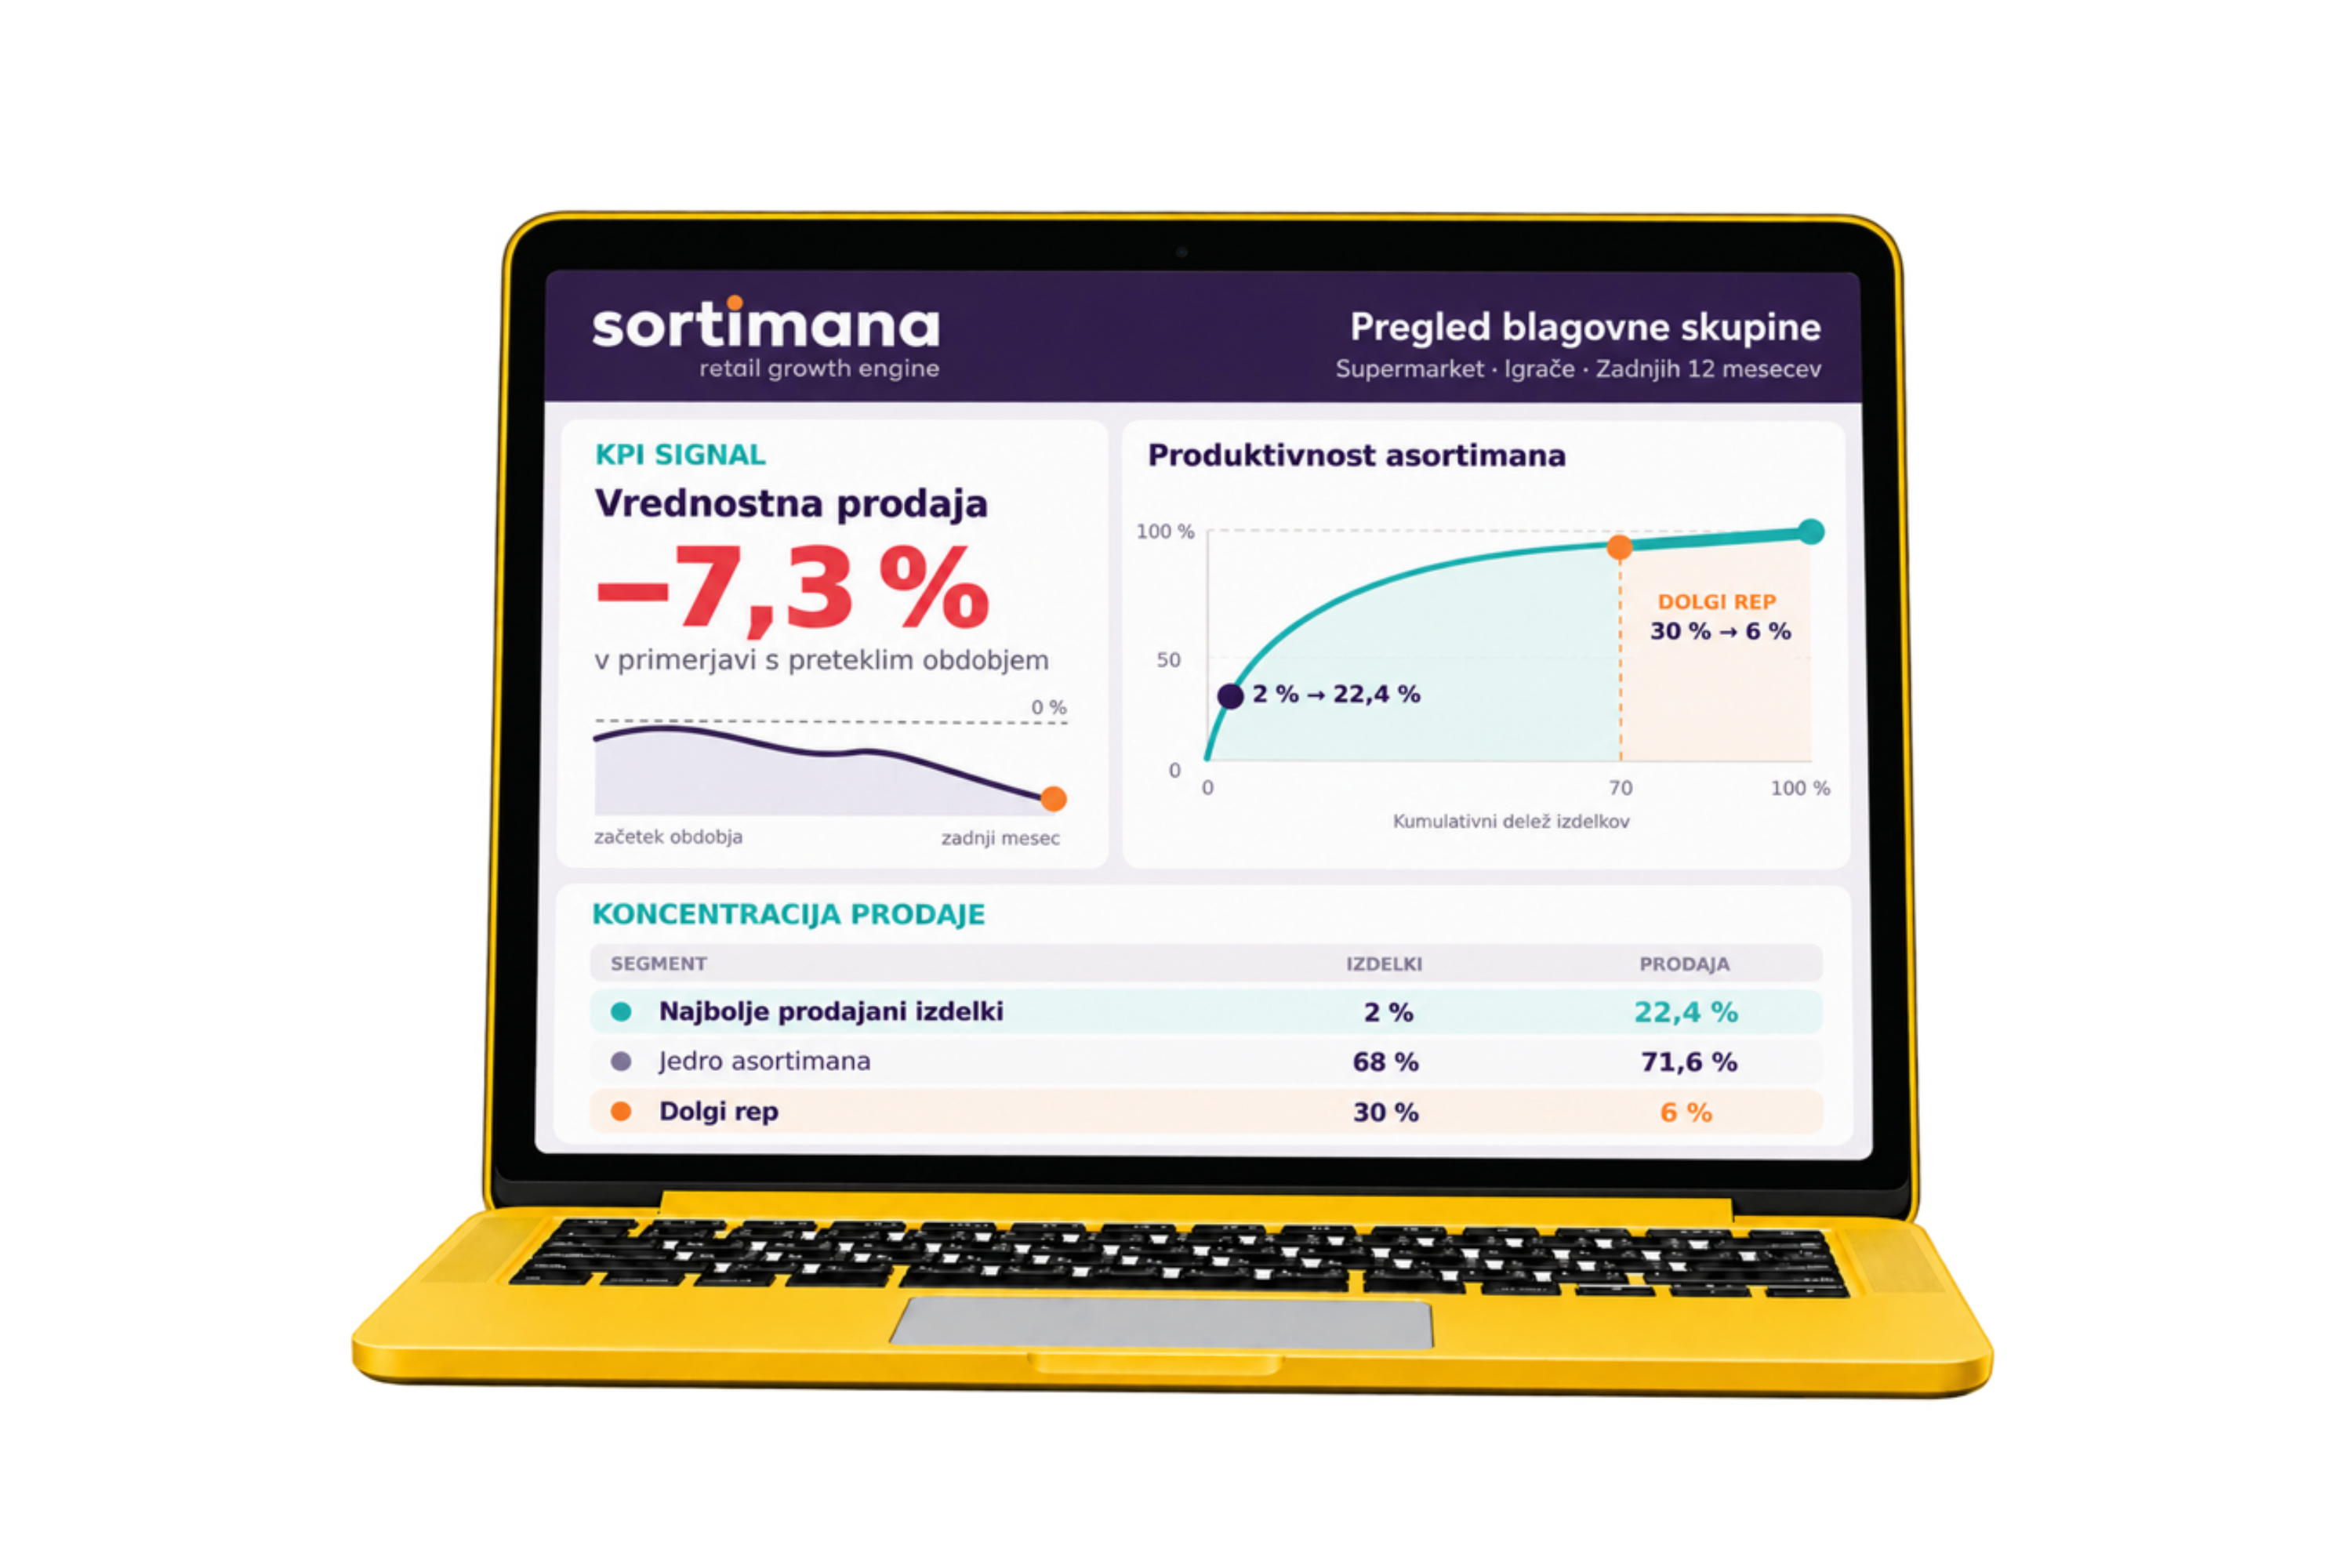
This case comes from a real store. A supermarket, a seasonal category, 1,259 products with sales. Sales value over the last twelve months: −7.3%.
Every organisation has a ready answer to a signal like this: a promotion, a lower price, a new supplier. Or, more and more often lately, a shorter range. We first looked at how the category was actually built.
Five hits and 600 products in the tail
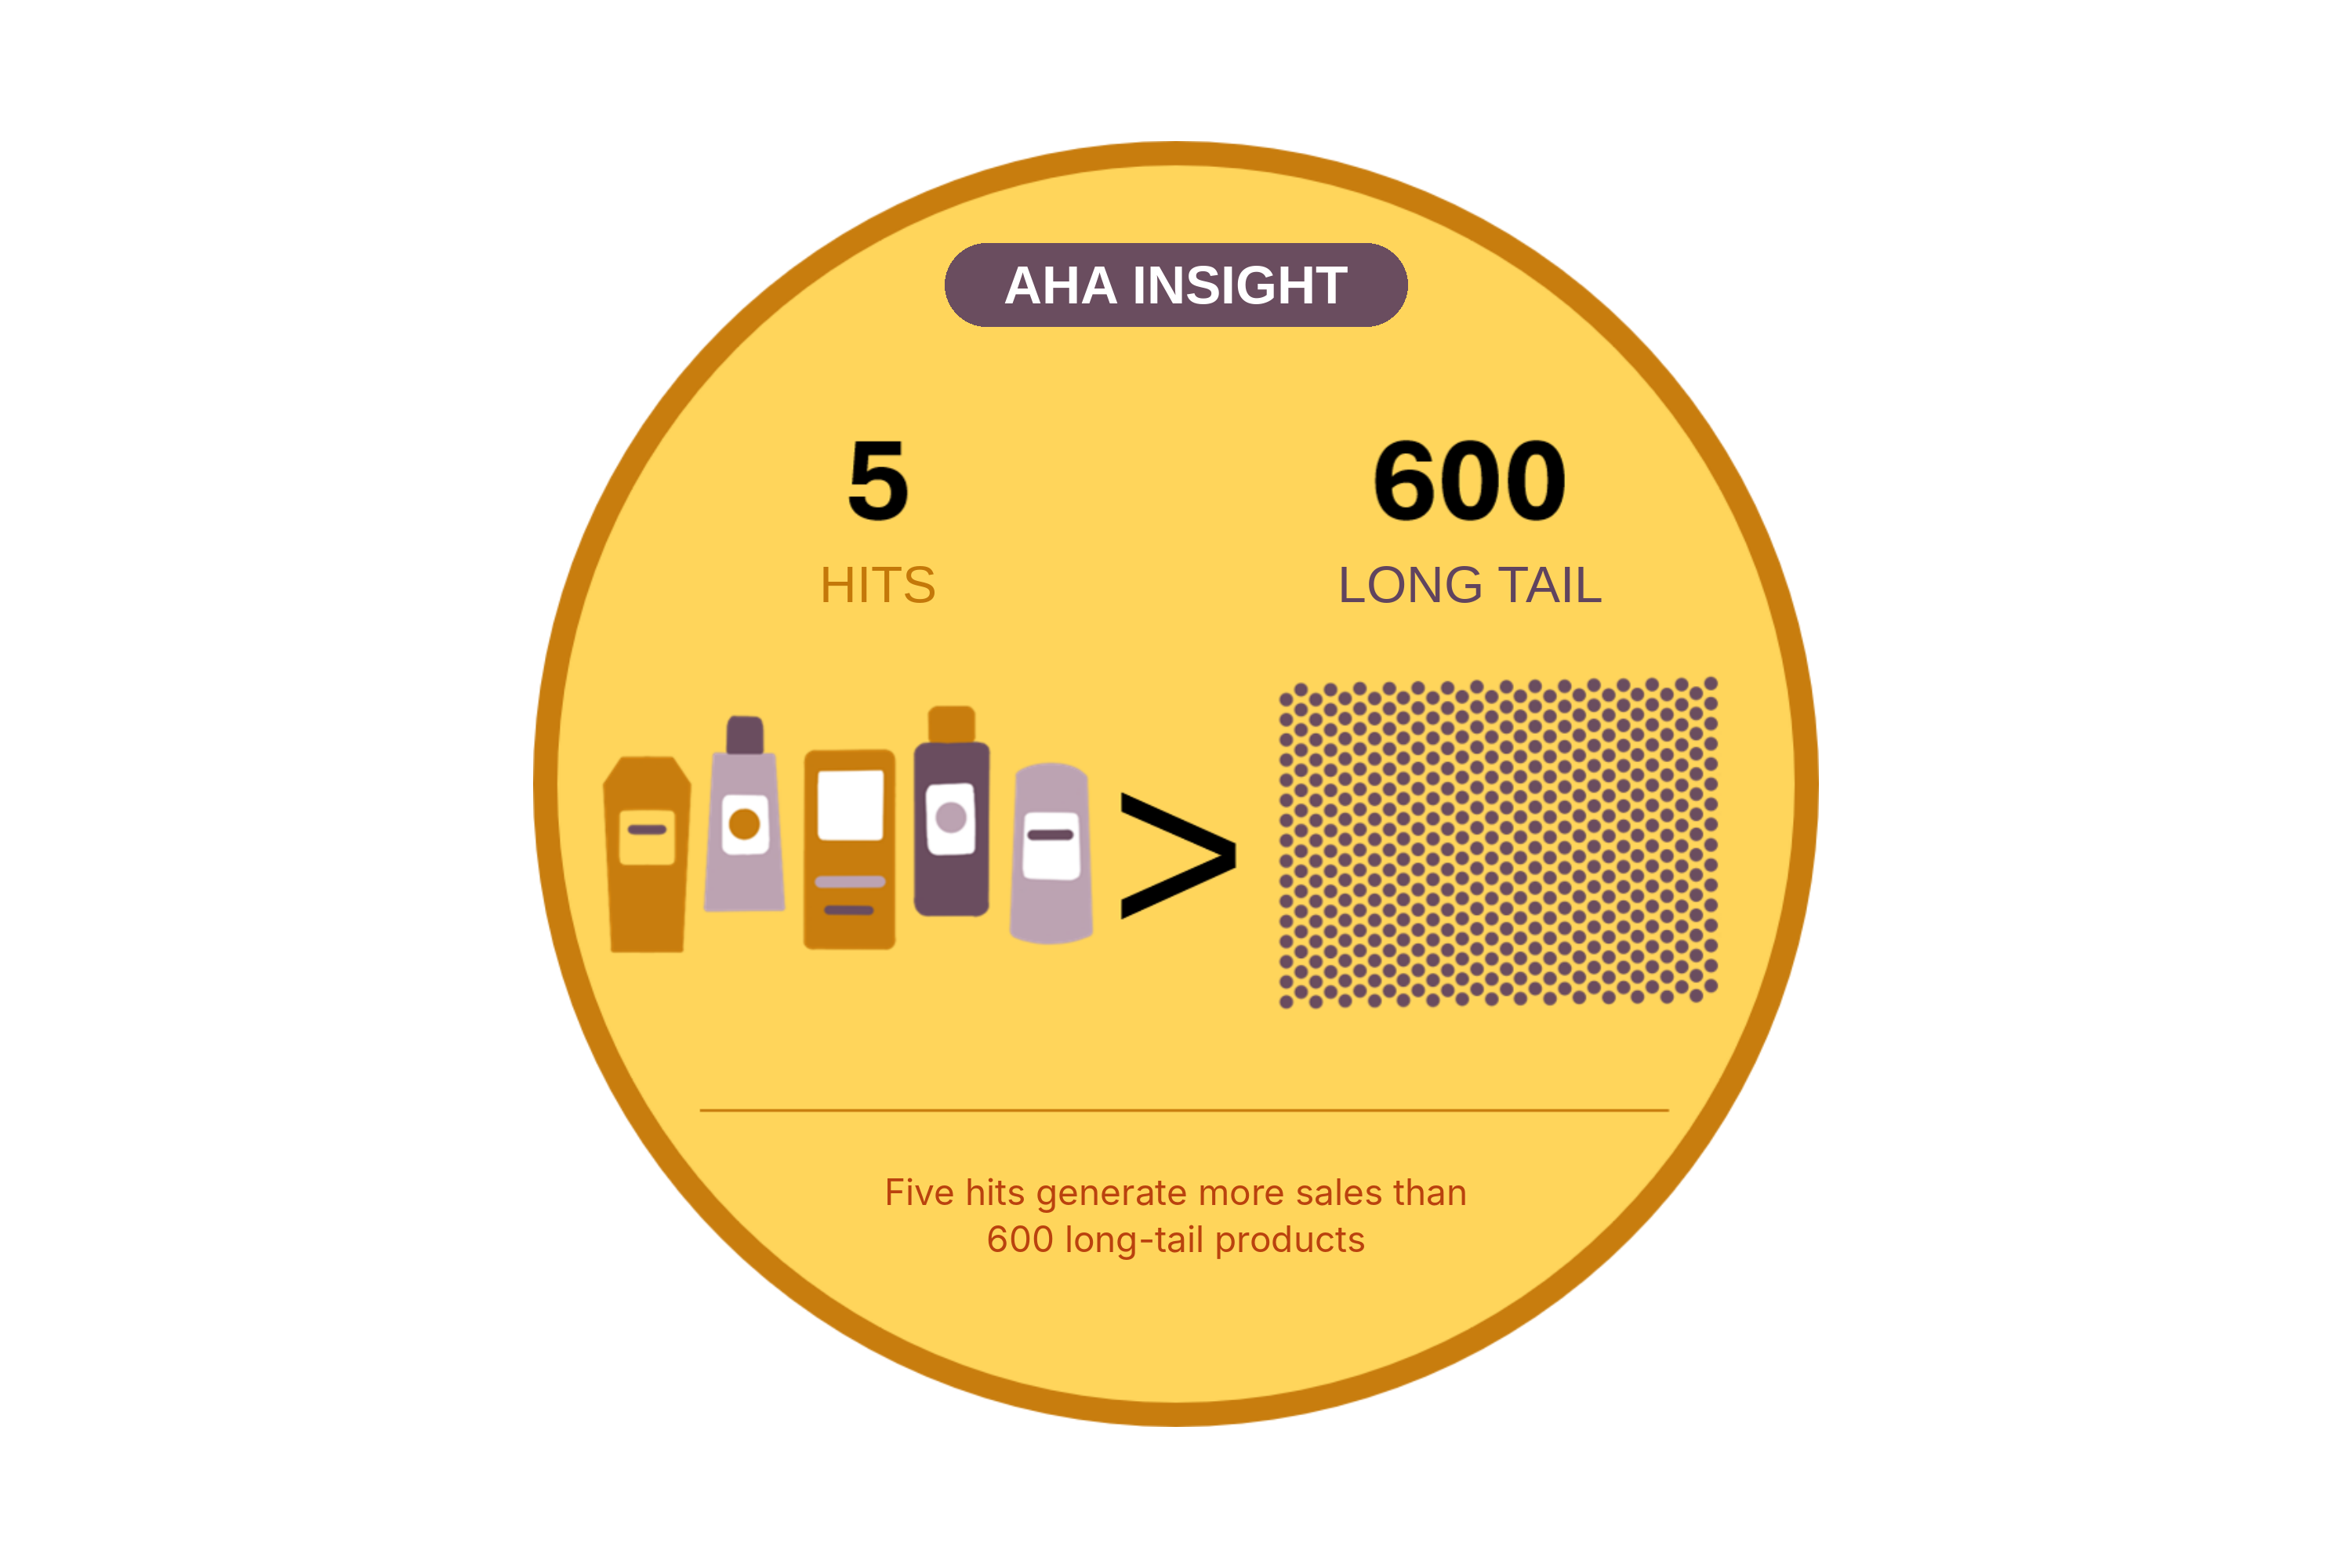
The five best-selling products sell roughly as much as the 600 weakest ones combined. On average, one hit sells as much as about 115 products from the tail. The bottom 30% of products bring in only 6.2% of unit sales.
This is the insight that works like a key. It reveals the hidden potential for category growth. But it doesn’t yet answer why sales are falling. It shows how the category is built, not what to do with it.
The first reflex: cut the tail?
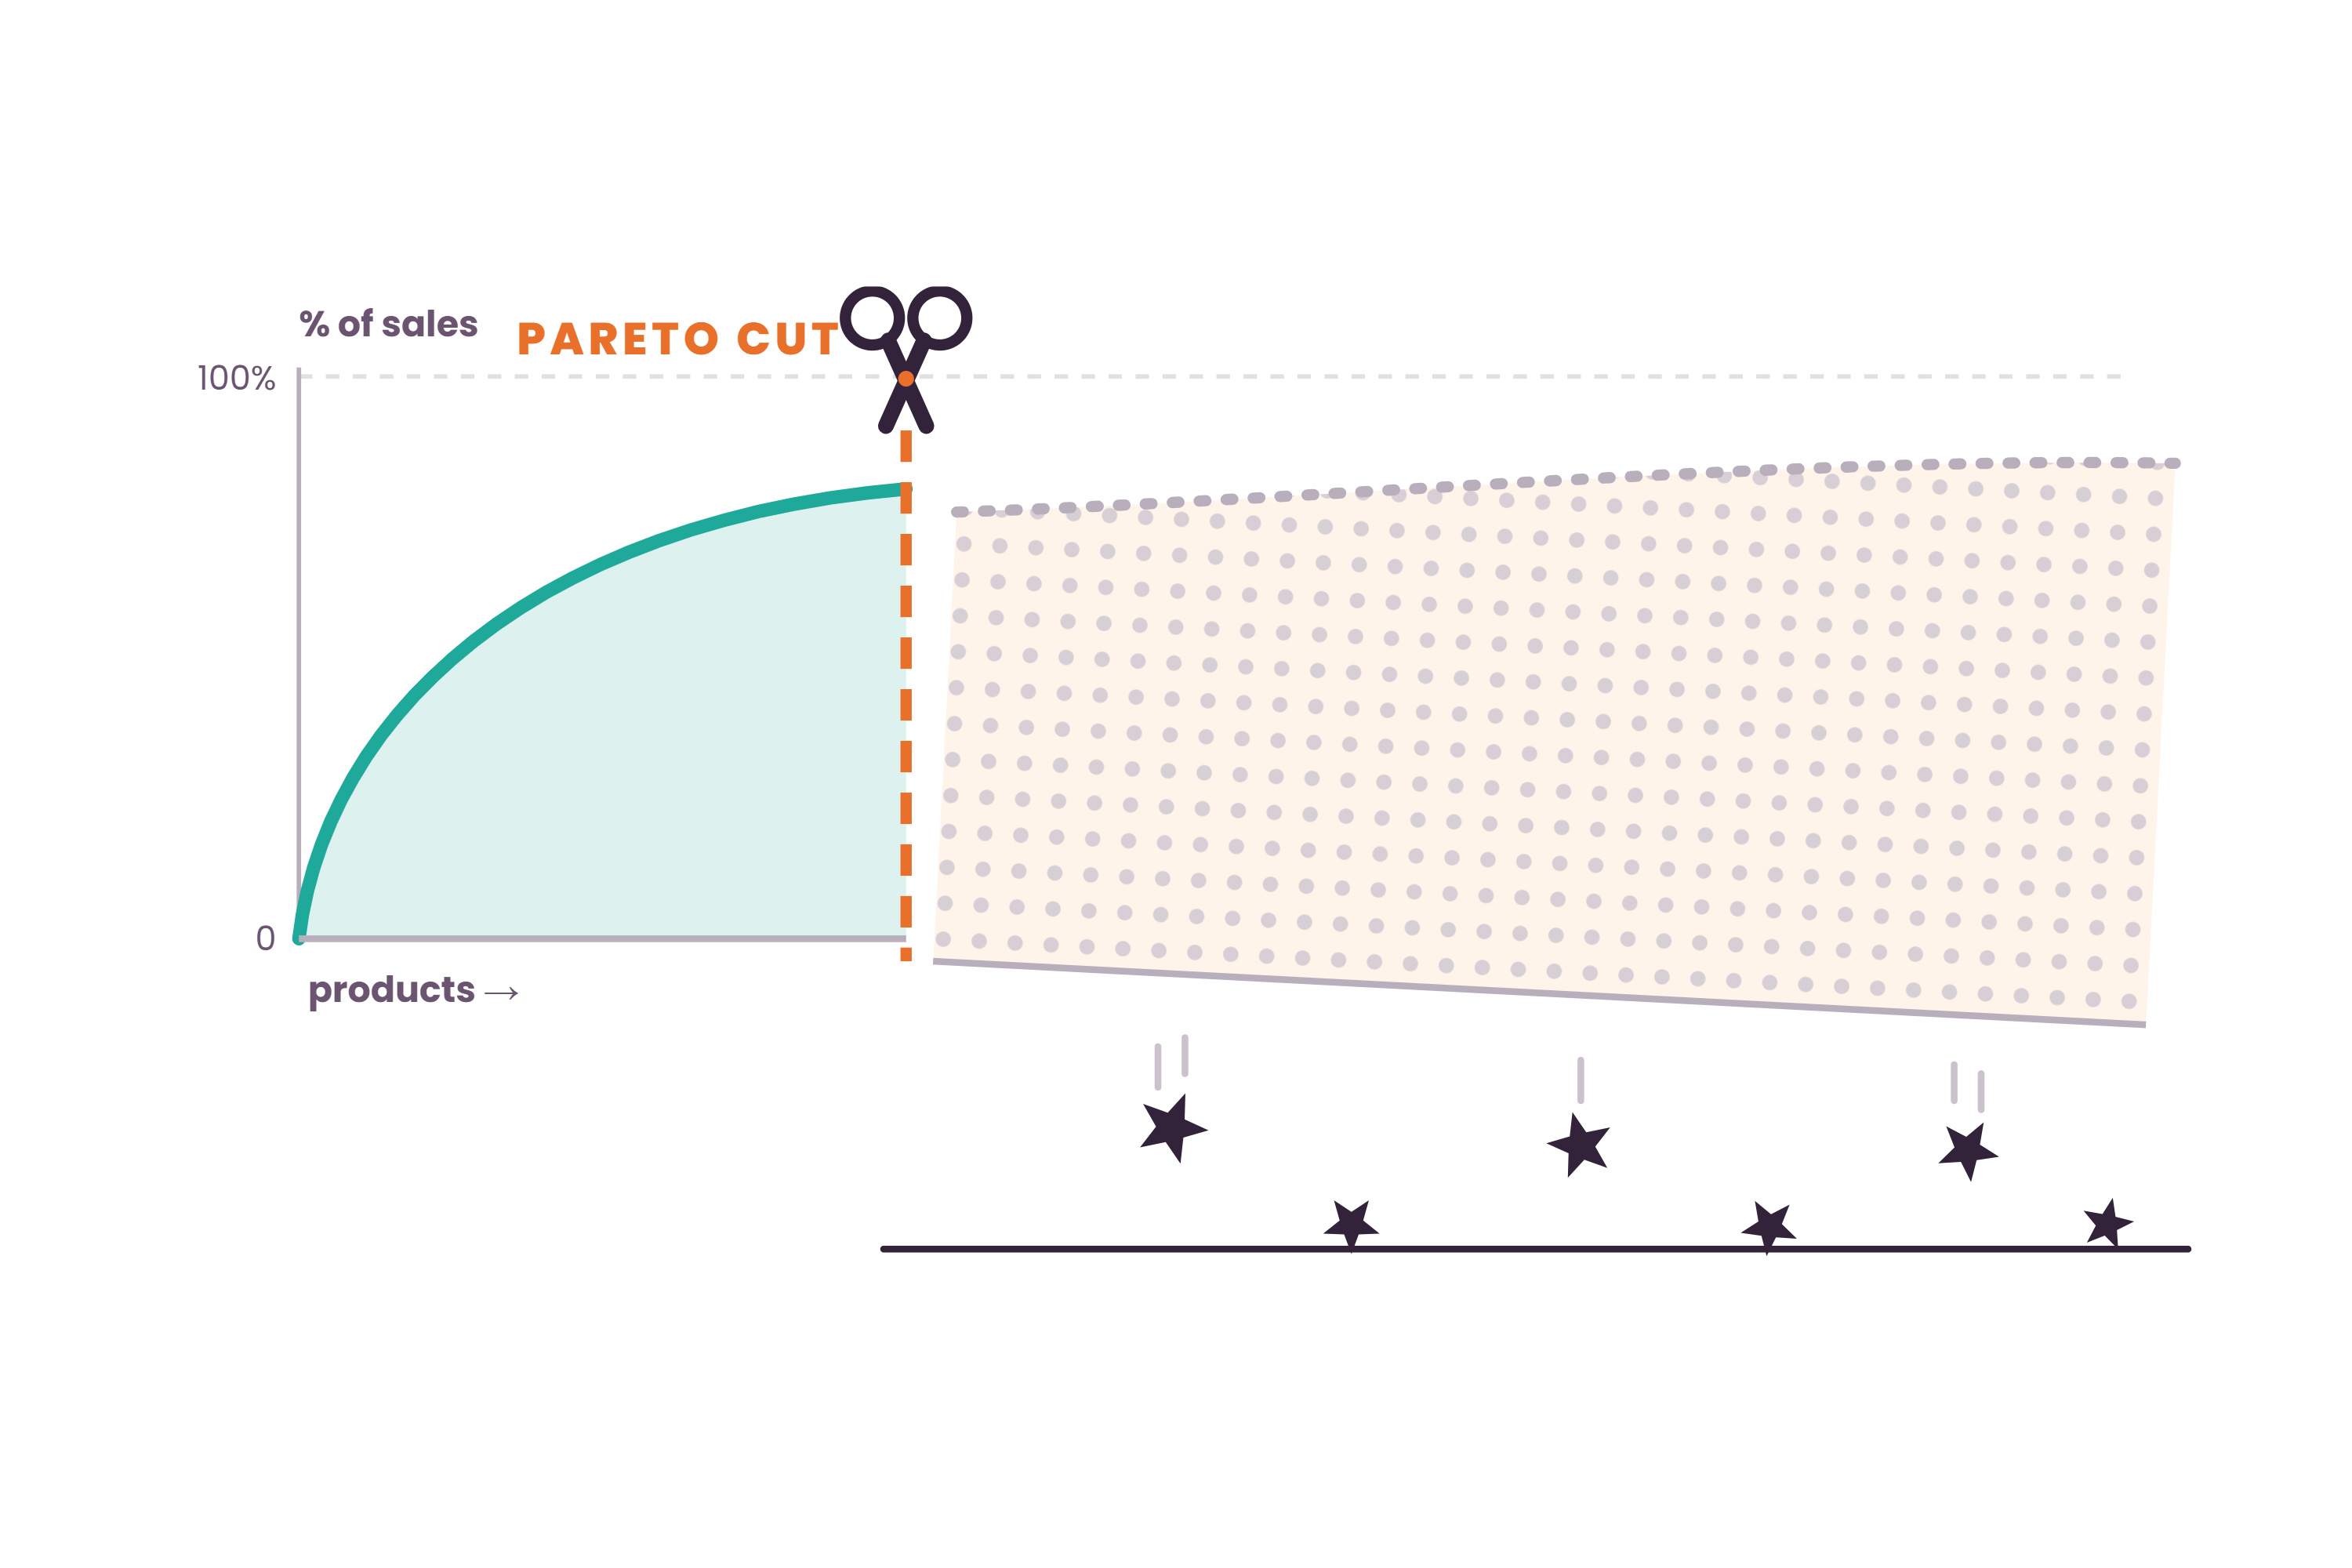
Faced with a picture like this, almost everyone has the same reflex. Pareto says the tail doesn’t work, so we cut it. In range management this is what a price cut is in sales: quick, proven, and often prescribed blindly.
Cutting blindly has a cost you won’t see in the spreadsheet. The tail also holds products that are the very reason shoppers come to you. Cut them, and it’s not the spreadsheet that misses them. The shopper does.
Where is the potential hiding?
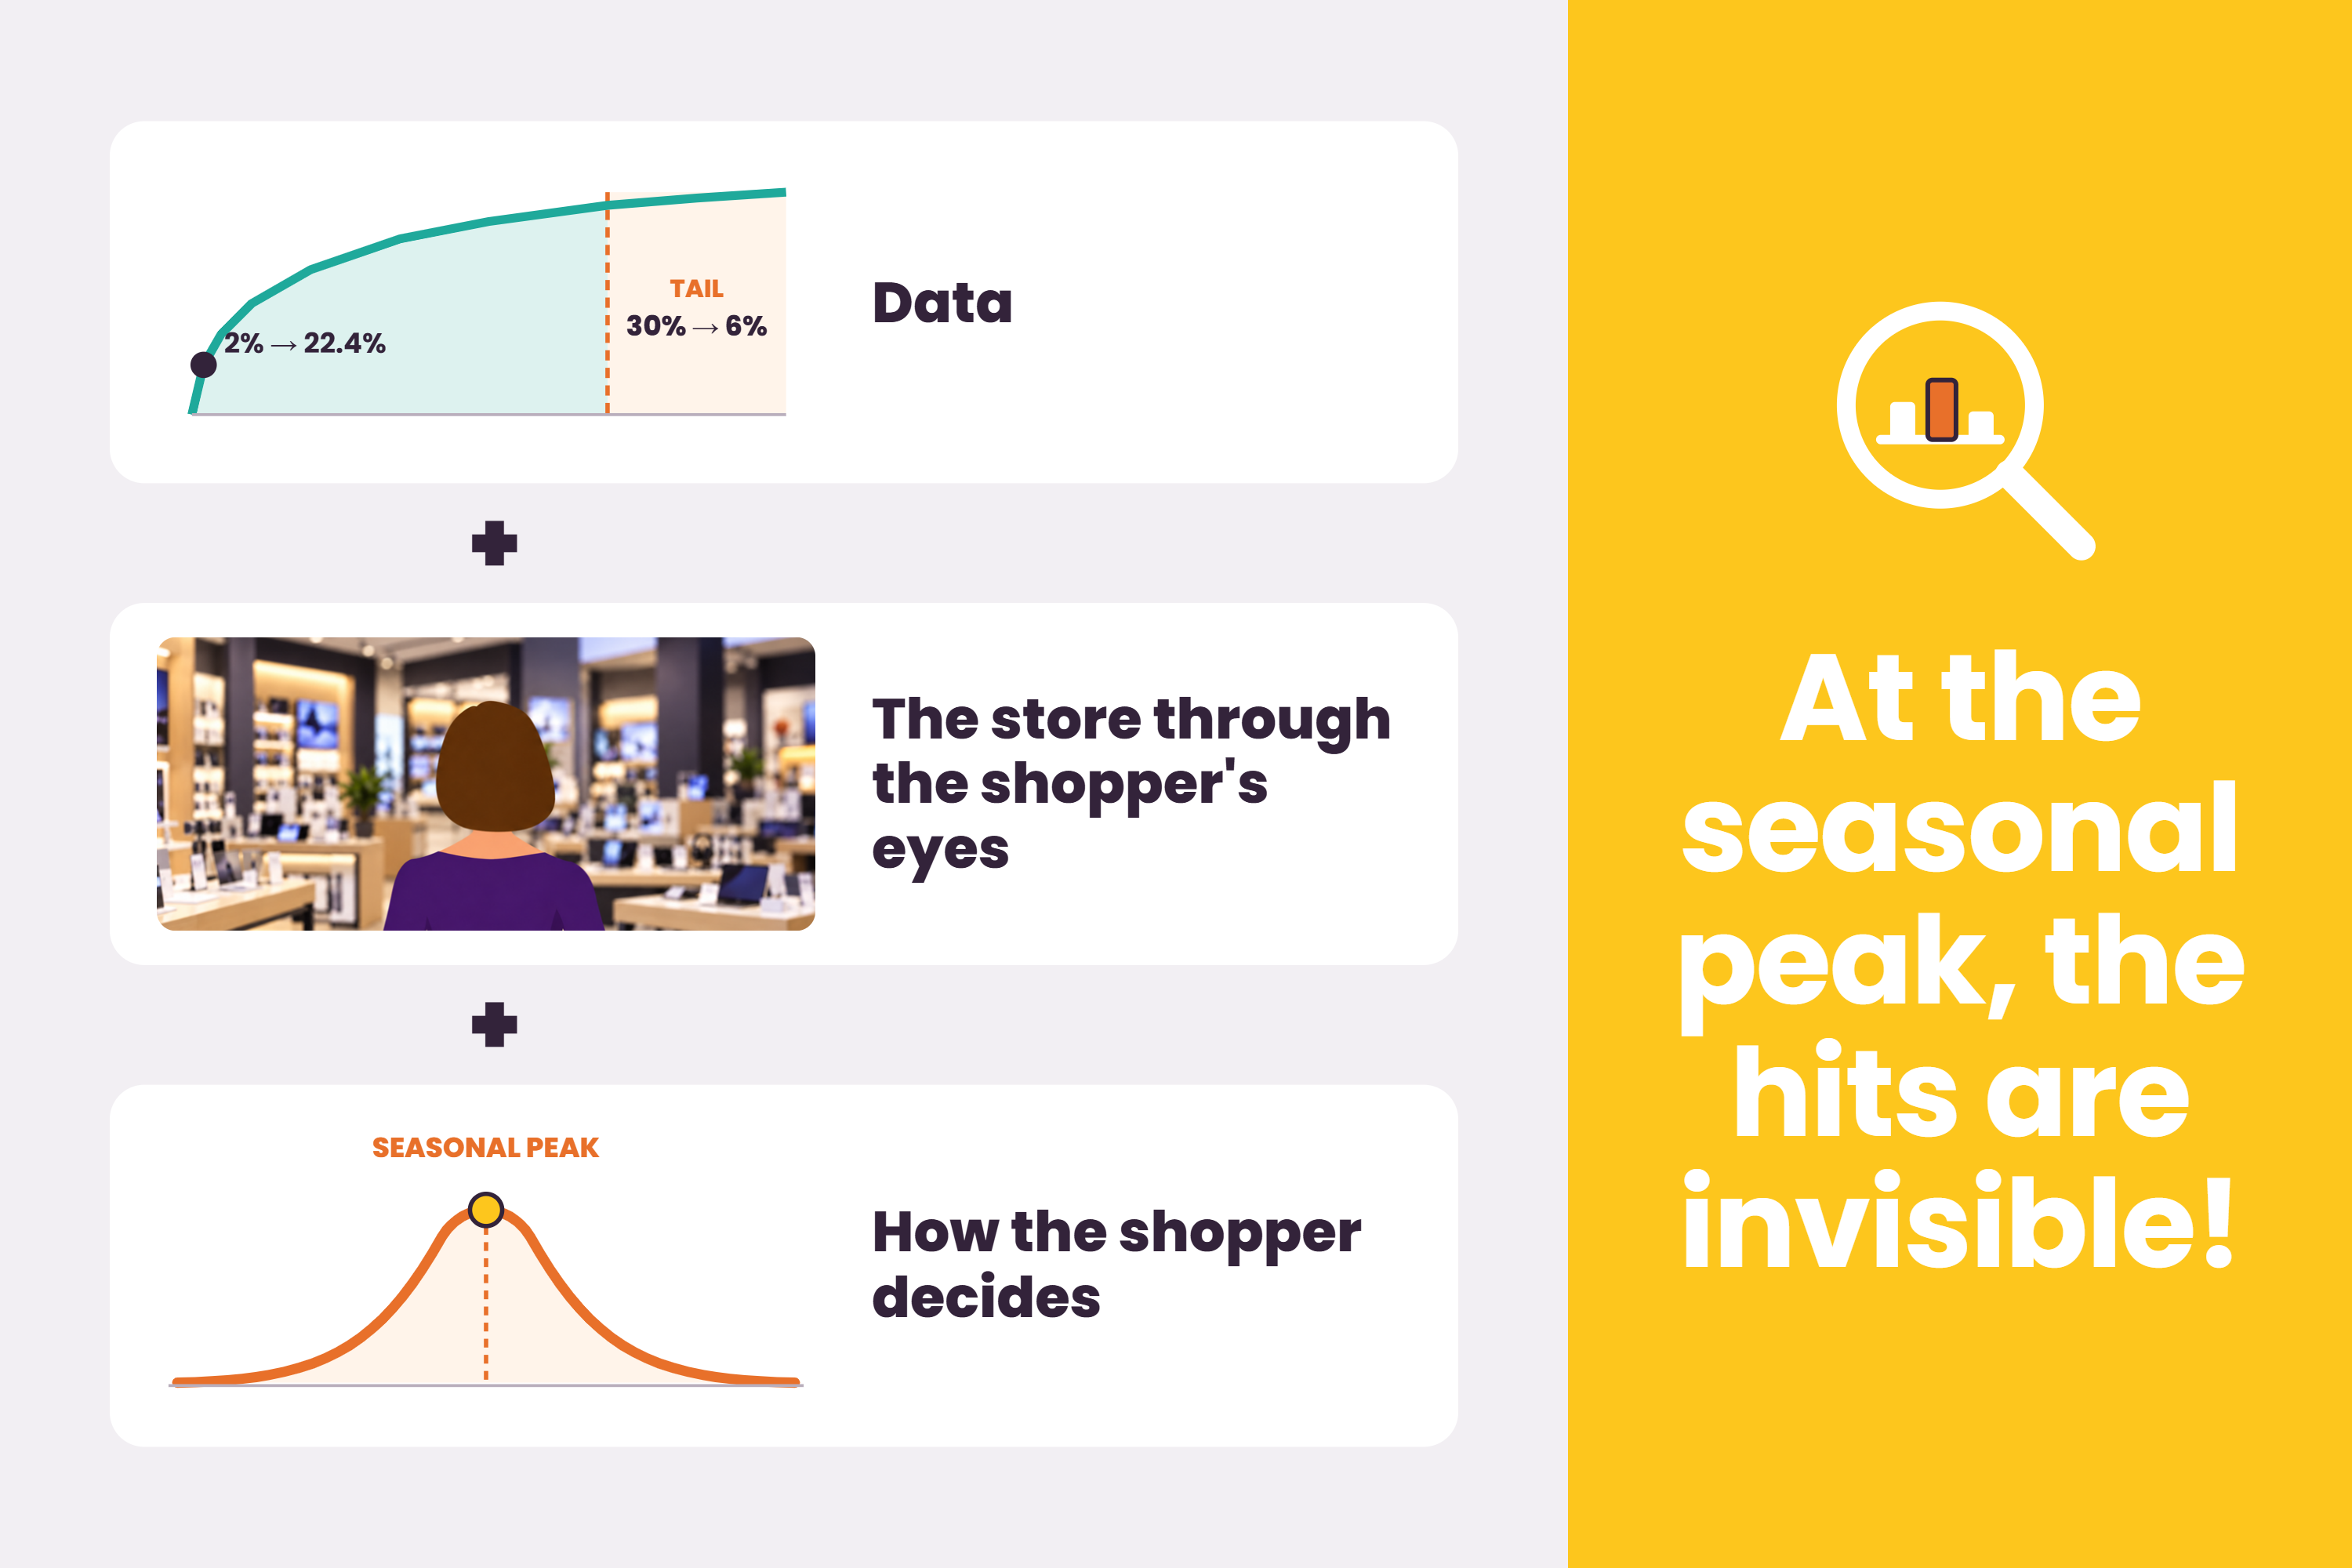
So we put the data next to two other views. The store, seen through the shopper’s eyes, showed:
a) an extended range with very poor rotation, a dusty category tail (and dusty quite literally),
b) hit products in the wrong place,
c) poor visibility during the main season, when the category generated most of its turnover.
And in this category the shopper doesn’t decide from a list, but when looking at the shelf, mostly in a short seasonal peak.Only together did the three views reveal the real problem: the hits were invisible exactly when shoppers were looking for them. A problem worth solving first.
What did we propose to this retailer?
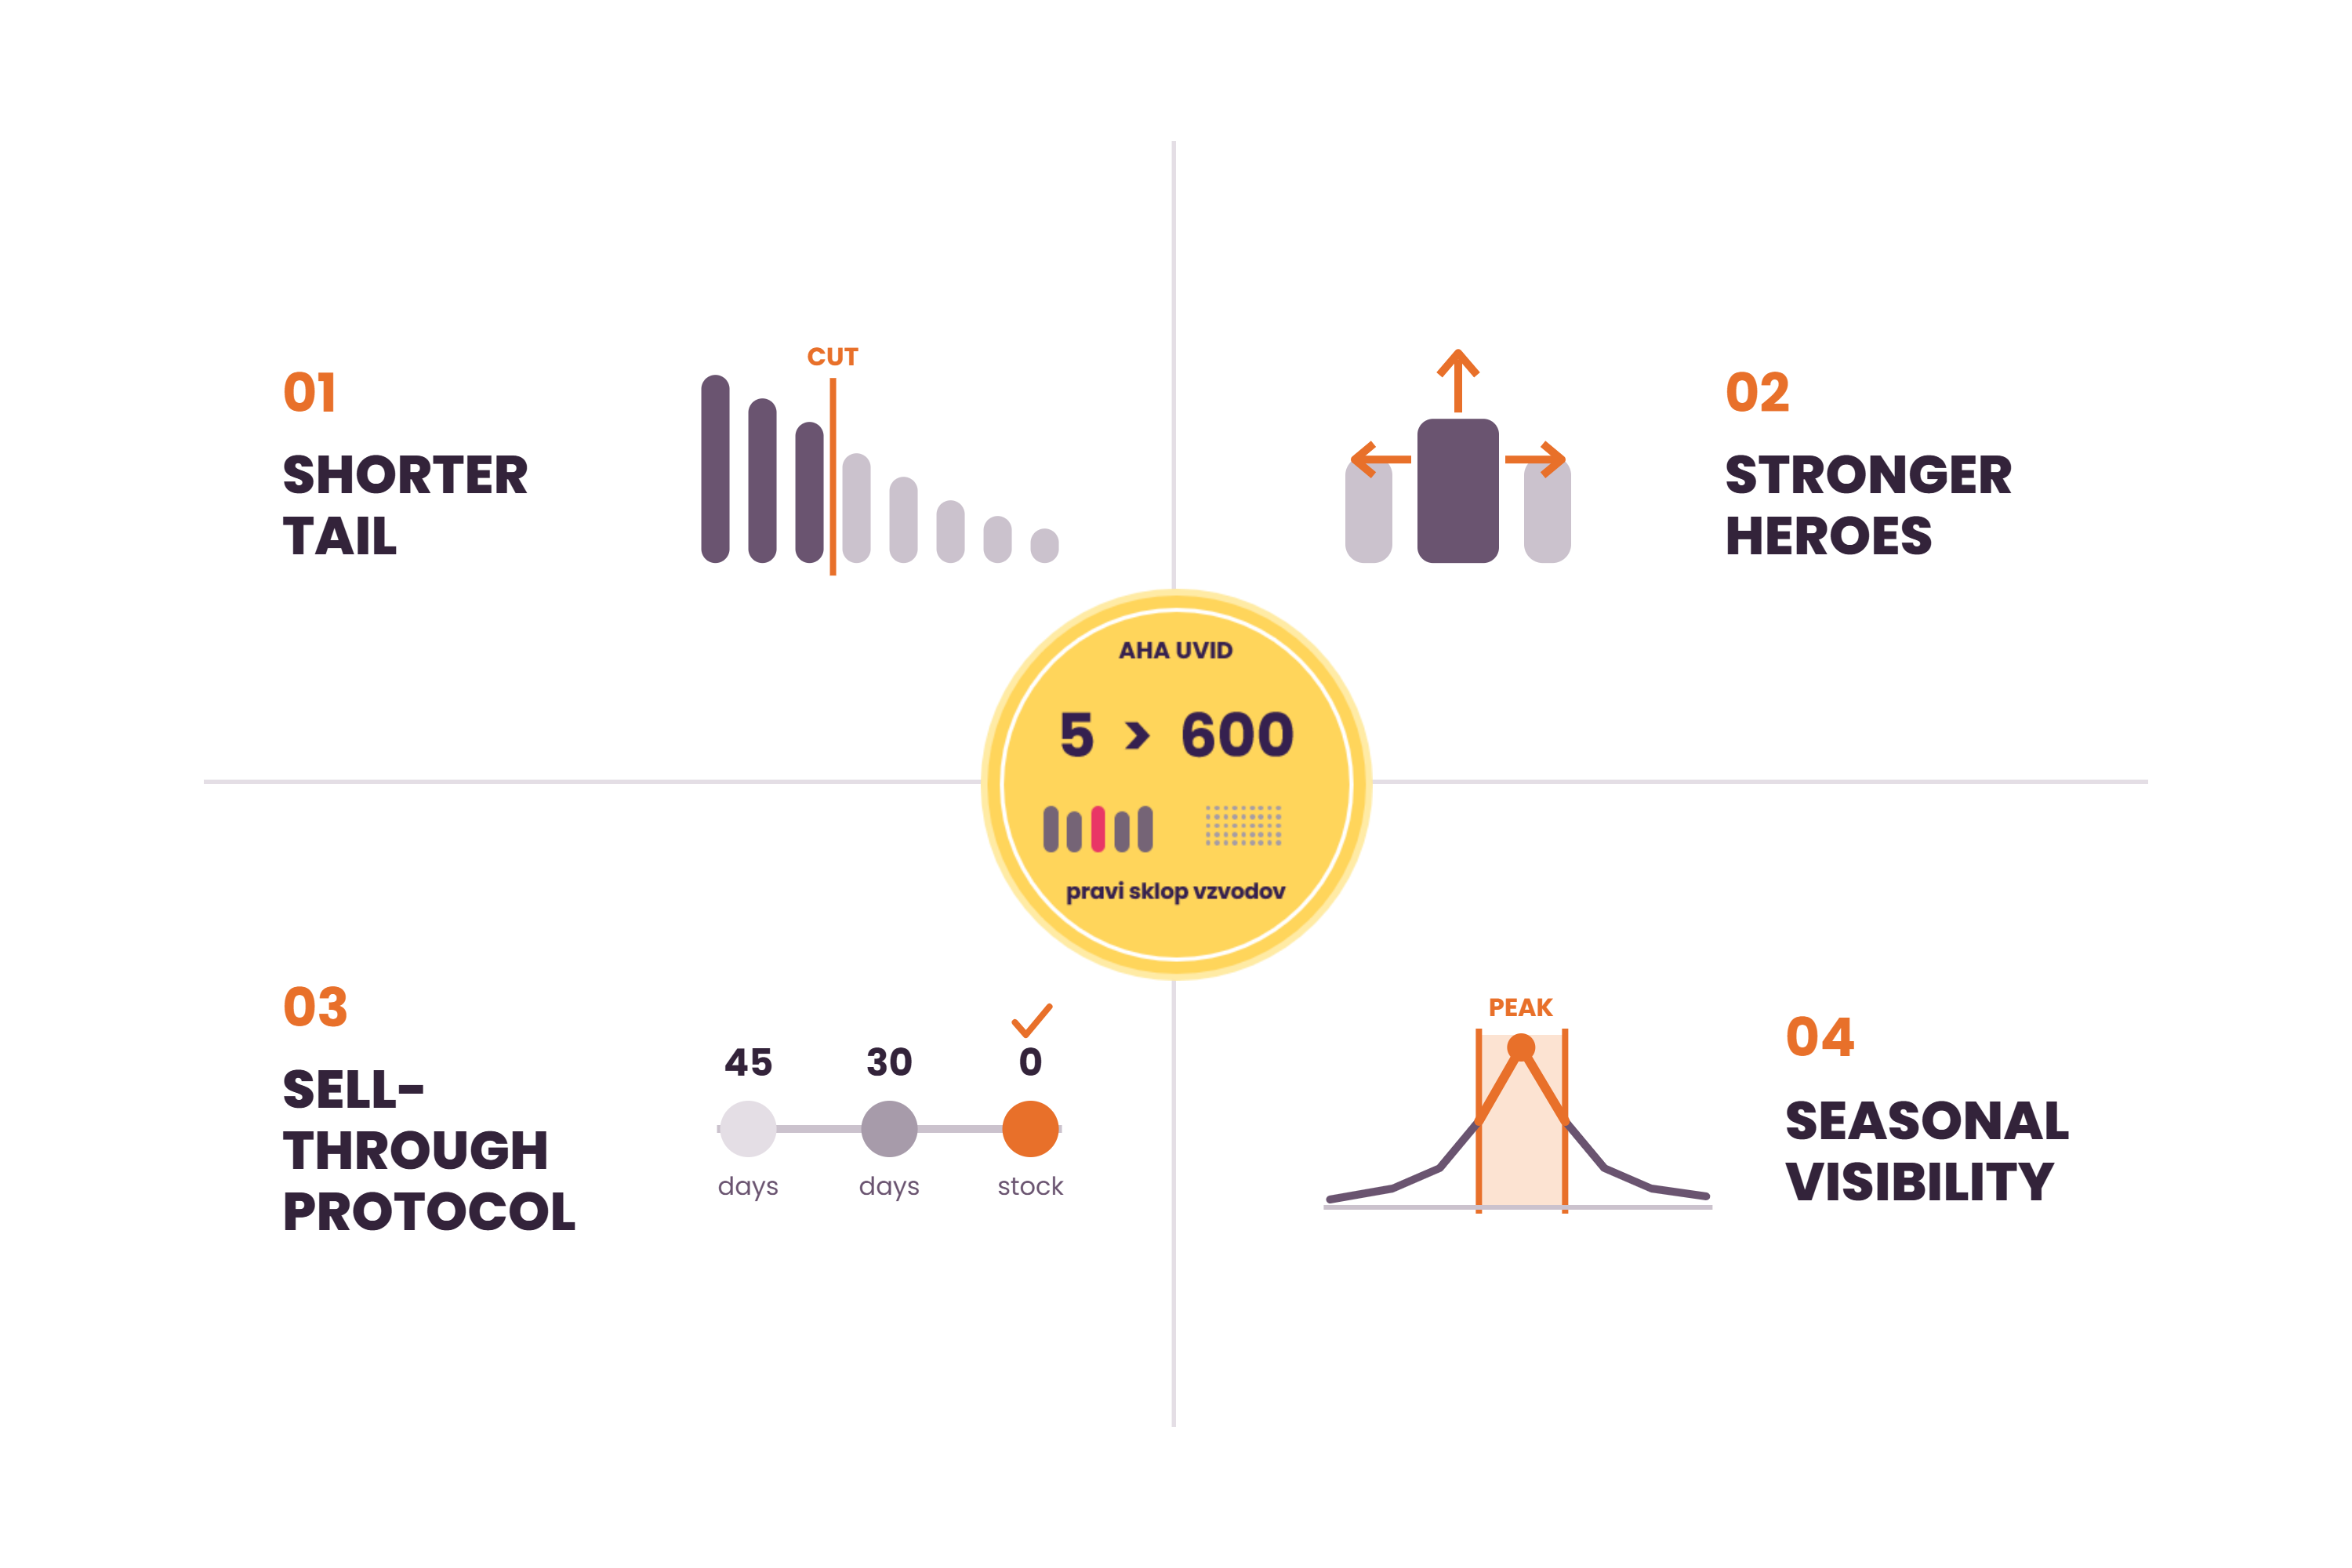
Not a single measure, but a set of four coordinated levers. A shorter tail frees up space. Stronger heroes fill it: more space, a second placement, reliable stock. A sell-through protocol with clear steps makes sure no stock is left once the season ends. And seasonal visibility makes the hits visible when the opportunity is greatest.
Each lever on its own would only do half the job. A cut without stronger heroes just empties the shelf. Heroes without the season go unnoticed. Only connected measures move the category.
What happened after the reset?
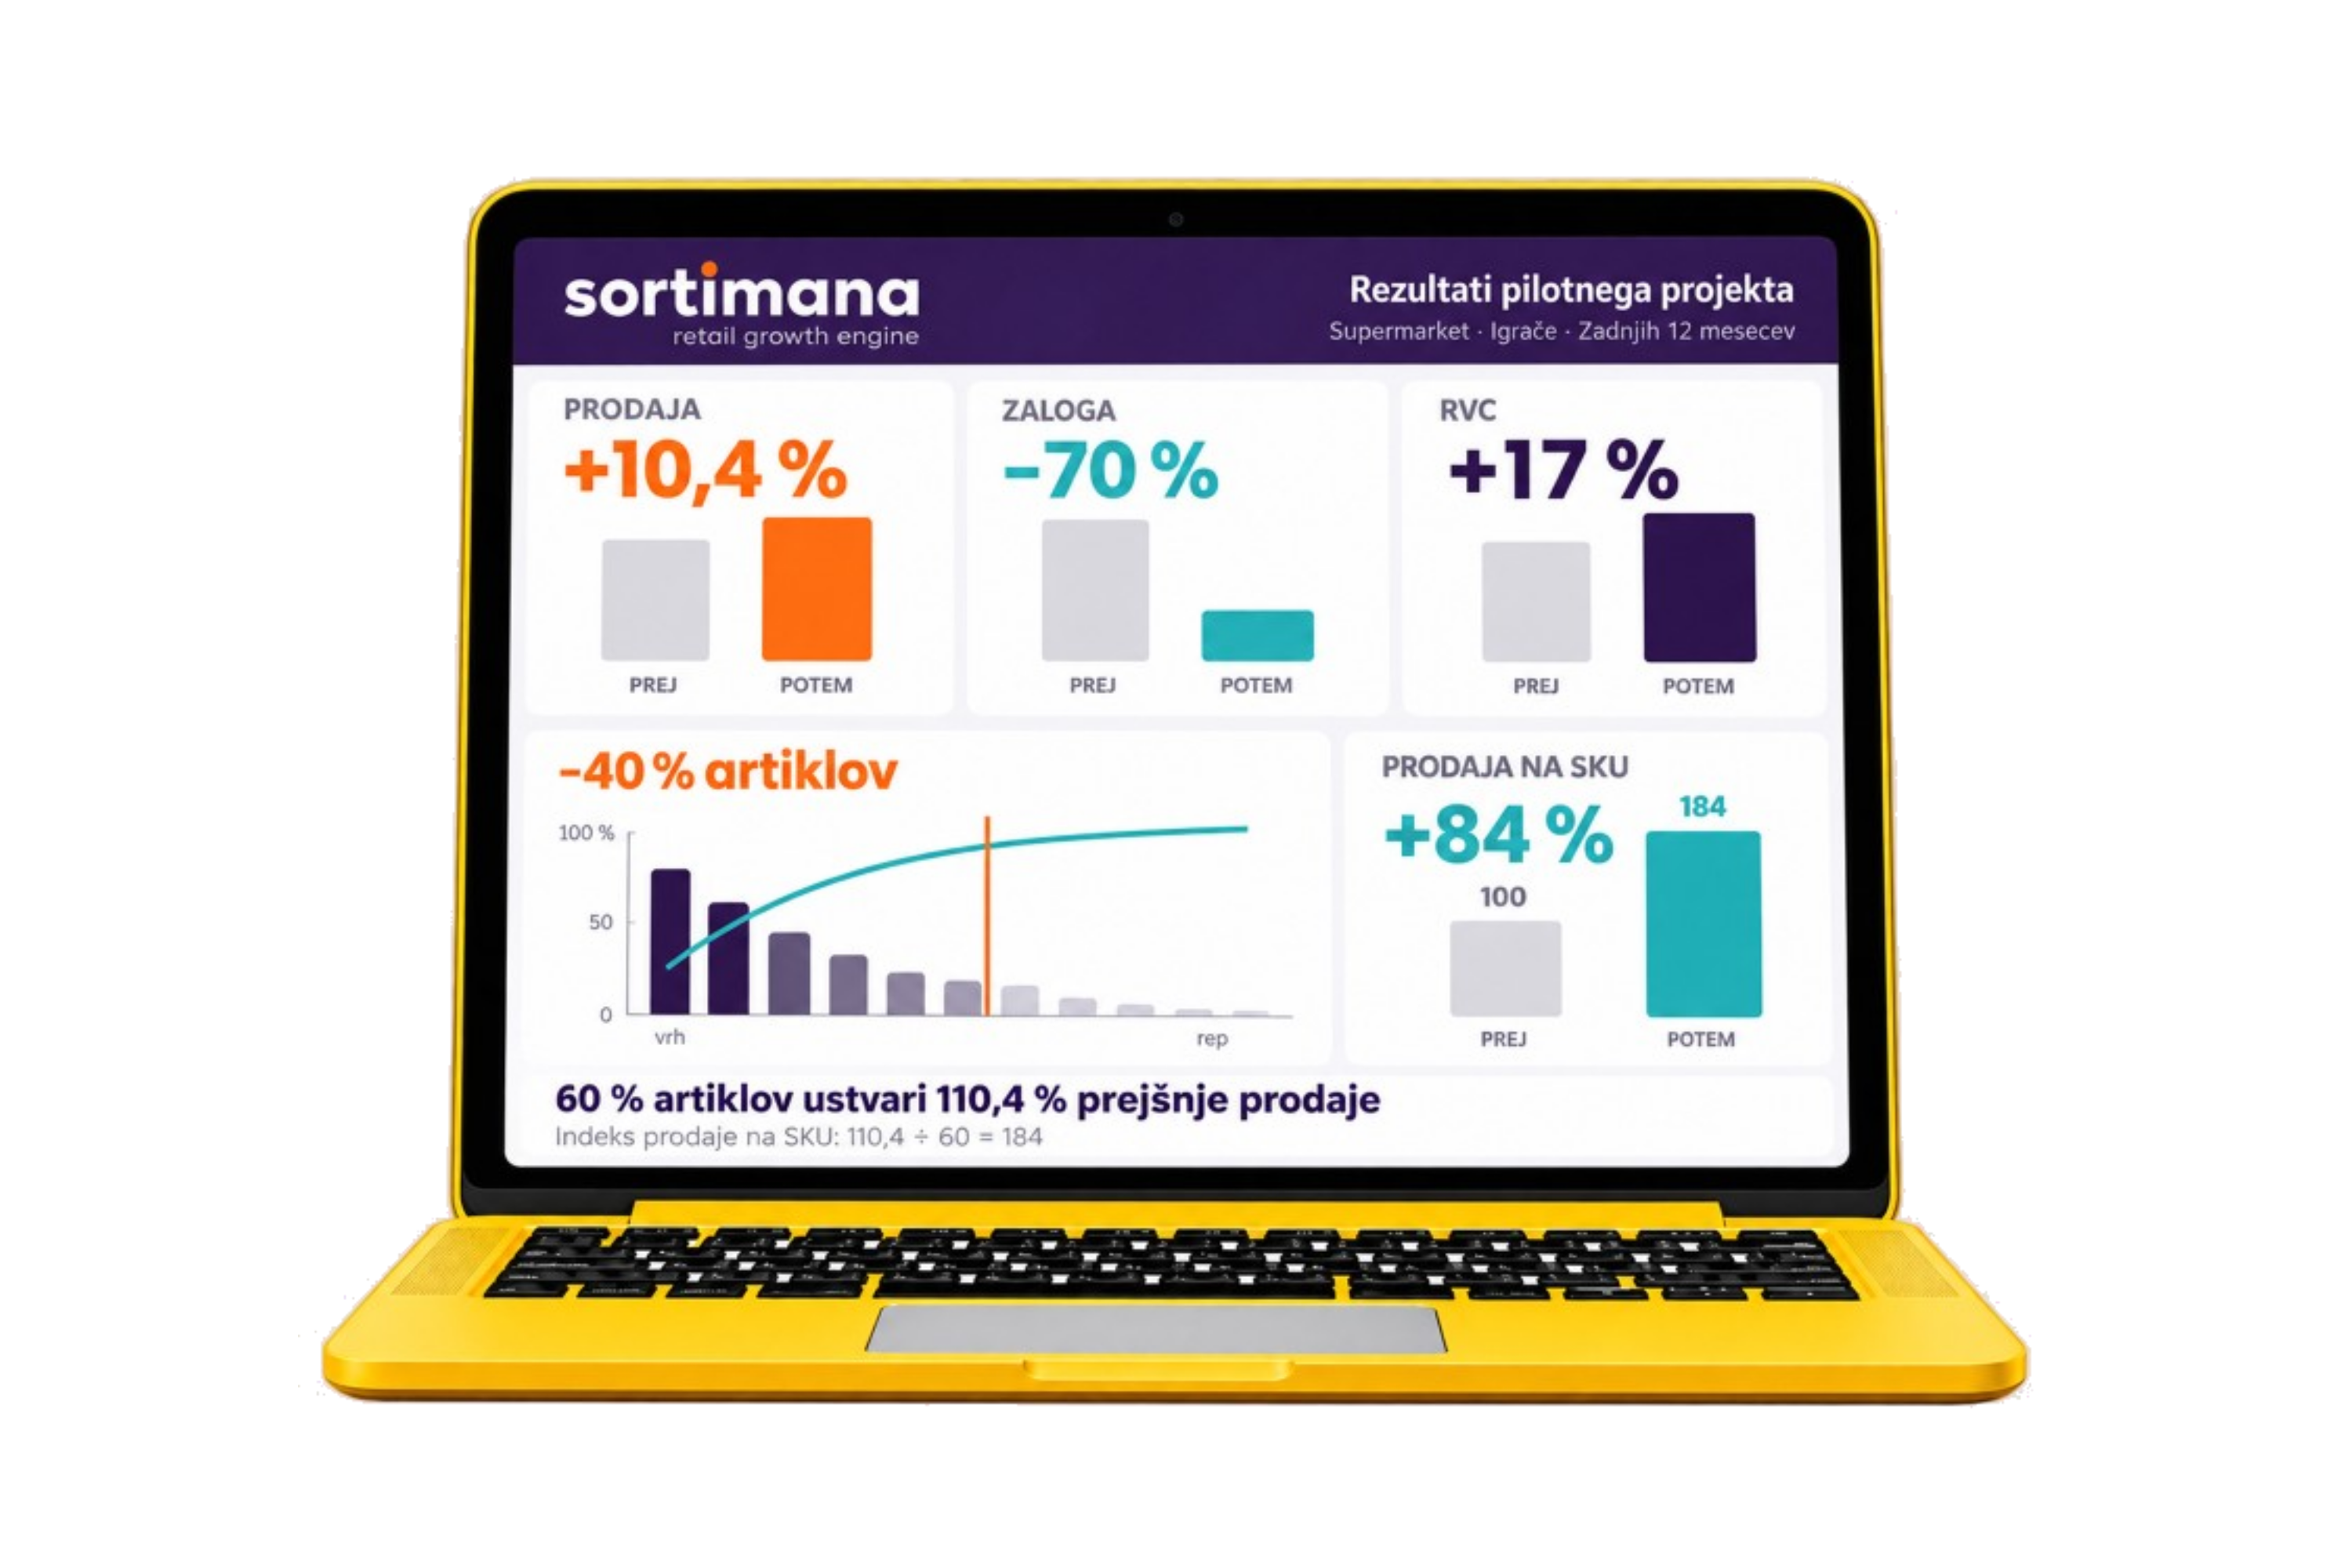
Fewer products, less stock, more sales. With 40% fewer products, sales grew by 10.4%. Sales per product rose by 84%, and stock fell by 70%.
The result matters, but the recipe isn’t universal. In this pilot the set of decisions worked because it was tailored to the role of this particular category at this retailer. A low starting level of order (the “dust”) also helped. That is exactly why the next question matters more than the result:
What if we looked at the same Pareto curve in a discounter, a supermarket or a specialist store? Would we make the same decision?
Note: Stock estimated from shelf measurements.
Would it work for every retailer?
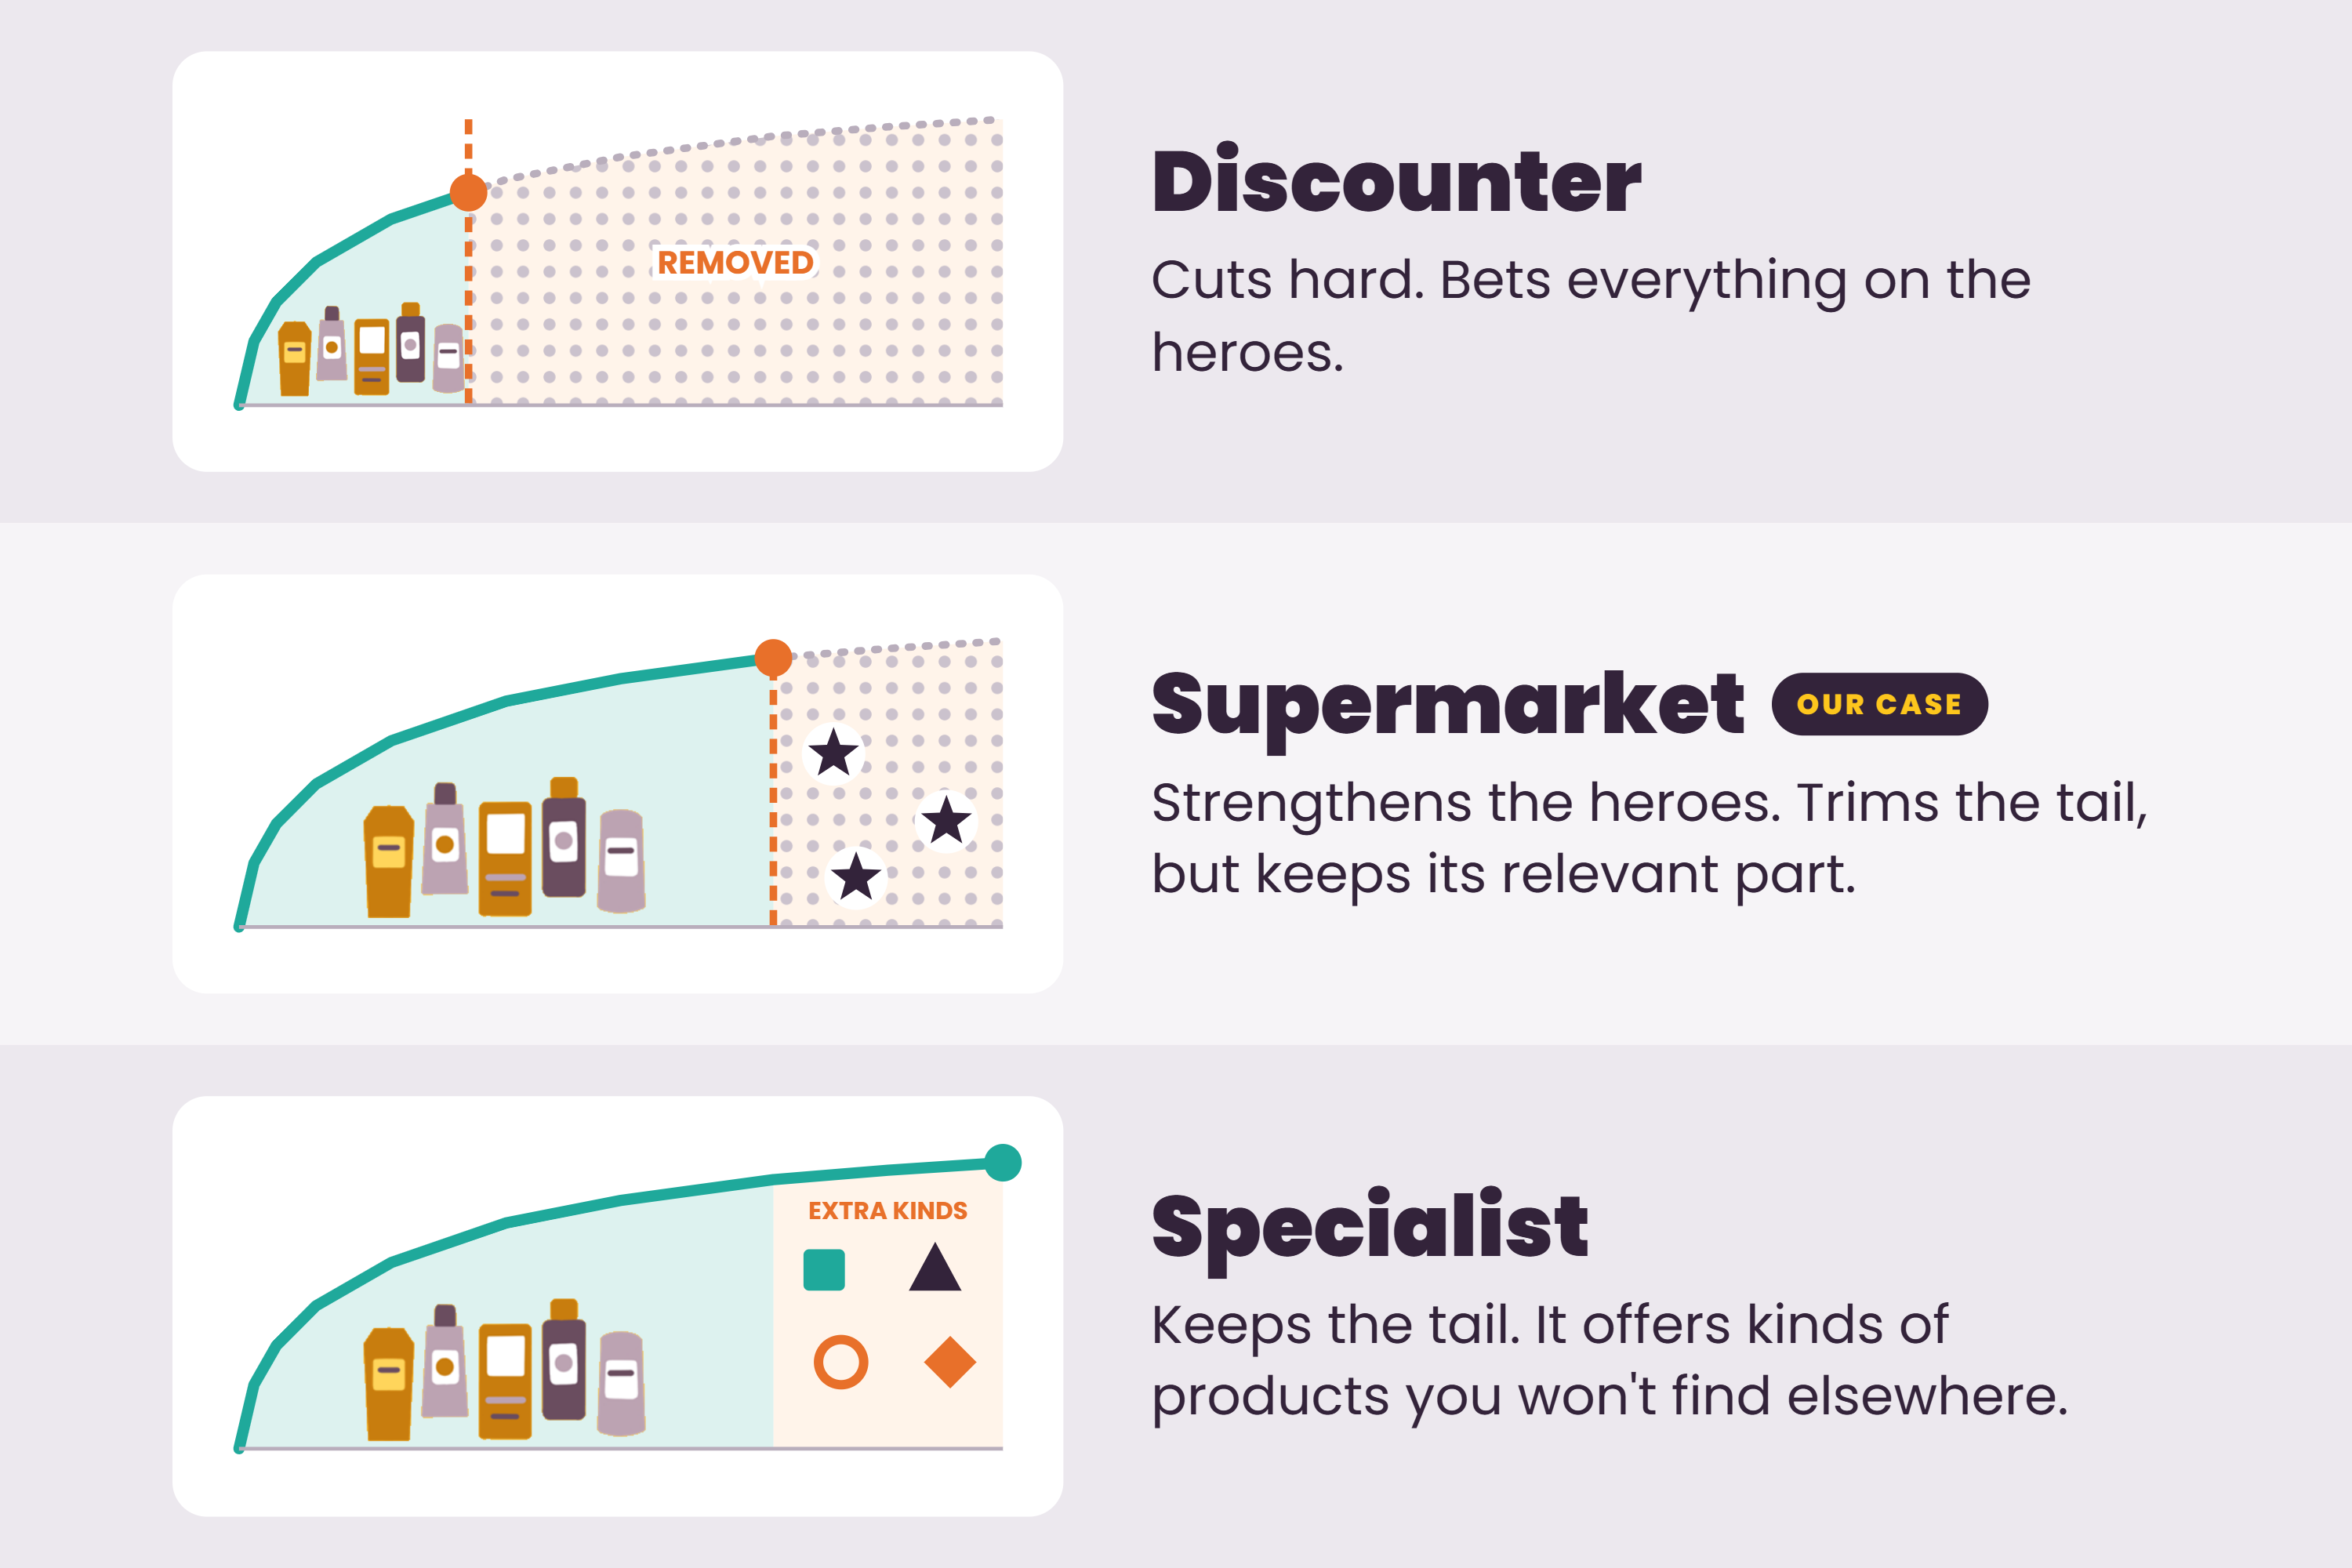
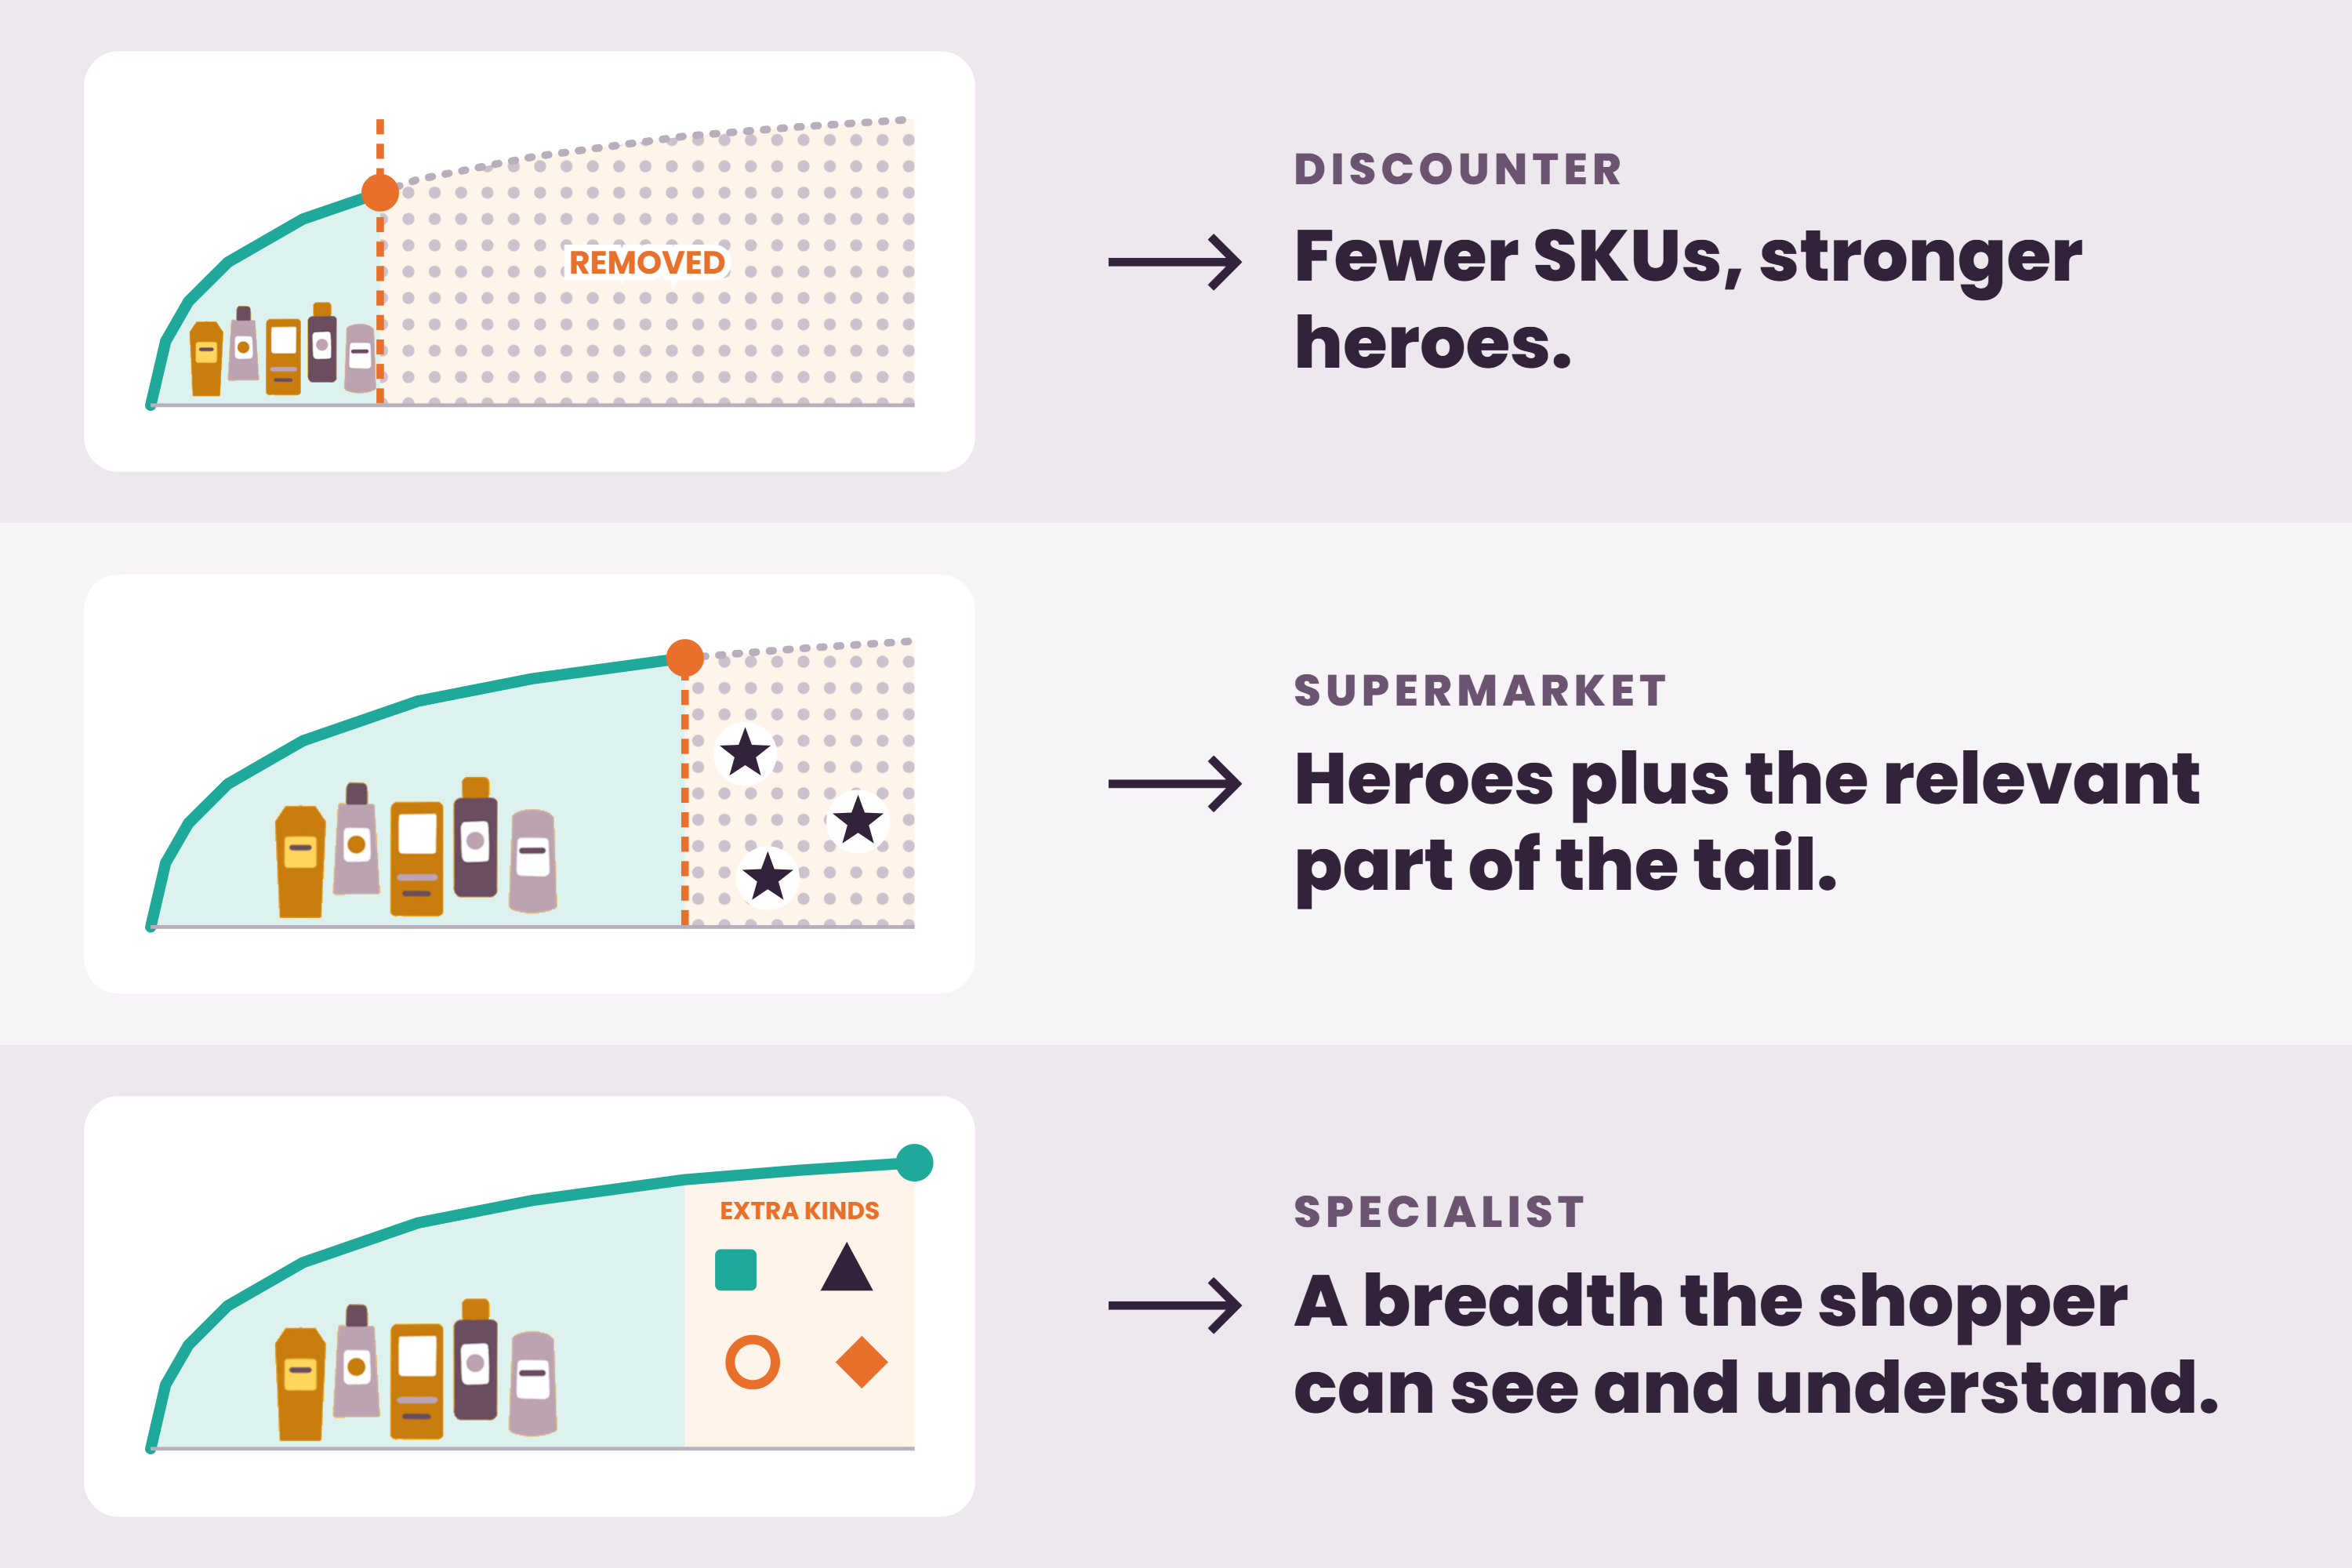
Not necessarily. The same Pareto curve can justify three different right decisions for three different retailers. Picture the following:
The discounter cuts hard and bets everything on the heroes, while also making the most of the season.
The supermarket, as in our case, strengthens the heroes and trims the tail, but keeps its relevant part.
The specialist keeps the tail, because it offers certain kinds of products you won’t find elsewhere. Its risk is offering almost the same as the supermarket – and with that, losing its relevance for the shopper.Same data. Different shopping missions and strategies. And so, different decisions.
The data tell you where the problem is. Which lever to pull is a decision no dashboard can make.
And what about suppliers?
If the retailer’s strategy drives the decision, the supplier has to know that strategy before coming with a proposal.
The same supplier will propose fewer SKUs and stronger heroes to the discounter, heroes plus the relevant part of the tail to the supermarket, and to the specialist a breadth the shopper can see and understand. A proposal that would suit every retailer usually suits none.
When the retailer announces the cut
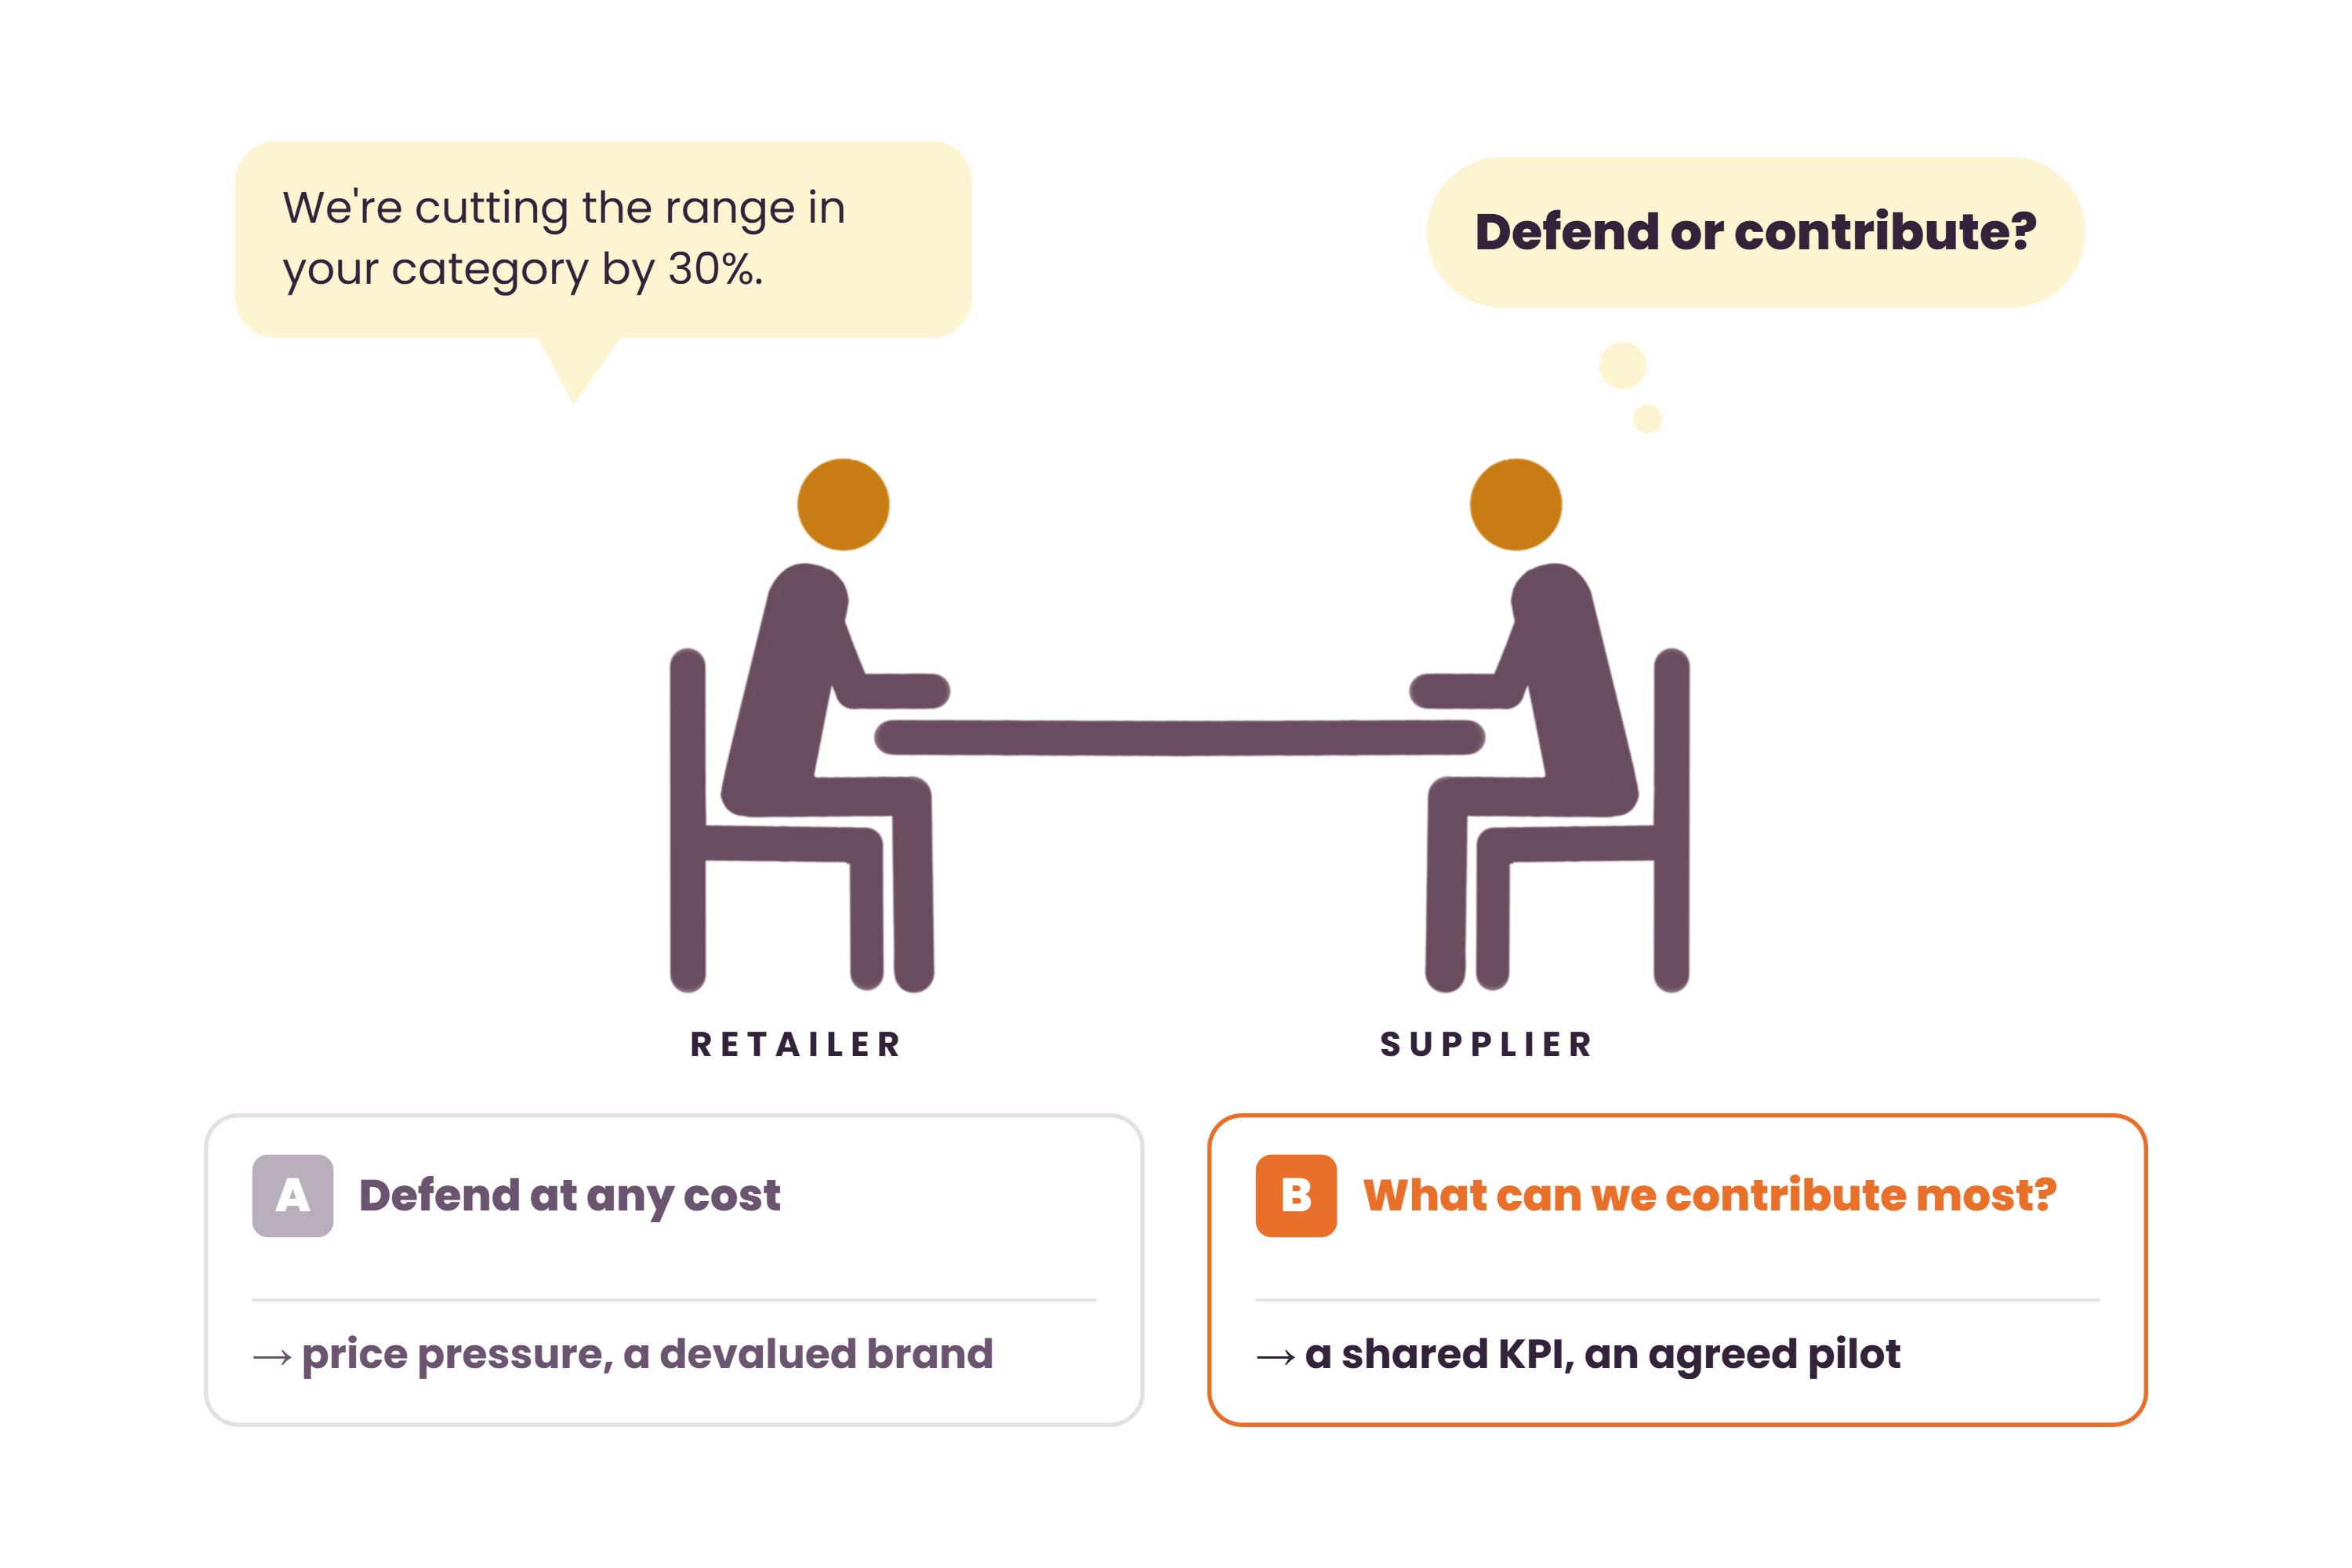
Picture a conversation between a retailer and a supplier.
Retailer: “We’re reducing the range in your category. We’re delisting 30% of the products.”
At that point, the supplier has two paths.
ADefend at any cost“Please keep our listings. We'll offer an extra discount and co-fund promotions.”→ It may work in the short term. In the long term it means price pressure and a devalued brand.BWhat is the most we can contribute?“We understand you want to free up space and cut stock. We propose 40% fewer of our products, two expanded heroes and moving part of the range online.”→ The outcome is a shared KPI, and perhaps an agreed pilot in 10 stores.Does the supplier’s proposal fit the retailer’s strategy and KPI?
Where is your brand?
The wave of range cuts won’t stop. The question isn’t whether your retailer will cut, but how. And whether you’ll take part, to strengthen the category.
Don't cut before you know what you can strengthen.
● FREE WEBINAR
How to find the right lever for category growth?
The right diagnosis. The right levers. A big shift.
Retailers are cutting their ranges. But a category’s greatest potential may lie not only in the products we remove, but also in the ones we can strengthen. Using the real 5/600 case, we’ll show how data, a look into the store and an understanding of the shopper take us from KPI diagnosis to concrete levers and measurable results. What can your brands contribute?
Thursday, 26 November 2026 · 10:00 CET · 60 minutes · online Registration until 19 November
Leave your name and company in the contact form, mentioning the webinarOmnibus
